A few days ago, I read an article called Among Friends: How Naughty Dog Built Uncharted 2. The interesting screenshots on the third page gave me the urge to create what I call an “on-screen profiling” tool for Spring Up XNA. I talked before about profilers and how to use them to find which sections of your code need to be optimized. But a visual tool is really handy, because it’s real time, and with Edit and Continue on PC, you can even see your improvements live!
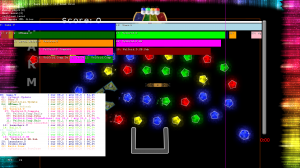
So, I spend some time working on it, and here is a sample screenshot (click to enlarge):
 The bars show the timeline of the current frame. In the bars, there is the name of the section. For clarity, all profiled sections are also displayed in plain text with the following informations: Name, Time elapsed this frame (in millisecond), smooth time elapsed, percentage of the 60 fps frame (16.6 ms). The vertical magenta line is the limit of the 60 fps frame. On this screenshot, my objective of 60 fps is not met, there are some bars displayed after it 🙂
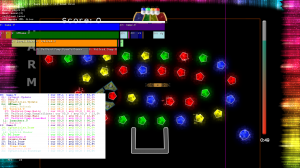
I am really happy with the results, you instantly see where optimization is needed and you also see the results quickly. For instance, after seeing the previous screenshot, I concentrated on the “Velgrid.D” section (section drawing the background effect that is seen in motion here). After some improvement, it still was not fast enough. I noticed that the problem was simply the overhead of calling SpriteBatch.Draw more than 5000 times. I therefore decided to write my own vertex+pixel shaders and you can see the result here:
 It’s now so fast that we can’t even see the name of the section in the bars and I have to have a look at the list to see the exact time taken by this section of the game (number 15).
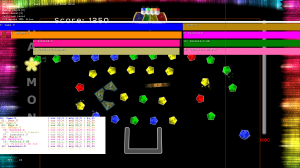
The profiling works obviously on both Xbox 360 and PC so I could compare both hardware. As I could read here and there, the X360 build is much slower than the Windows one. I made two screenshots of the same scene with a scale of the bars so that the length in pixels of the full frame is around the same on each platform. Here is the screenshot of the windows build that you can compare to the first screenshot of this post:
The “slower” sections are not the same. Globally, the X360 is better at using its GPU and the PC using its CPU. Of course, this is heavily dependant on the PC platform. For information, I am using a 3.4 GHz computer with a X850 graphics card.
And just for fun :), the first screenshot of the profiler on X360, before I started any optimizations:
 The frame took 165% of my objective target frame (60 fps). I can’t even see it all on screen. I am now at 75% of the frame, and with an additional feature (glow around objects, section 9 on the second screenshot).
So the small amount time taken to make this in-game tool is very well spent. It’s obviously quicker than running a profiler and waiting for the results, even if it’s not as precise. And the great thing is that this was easy and interesting to program 🙂
Really nice work – I made a very simple On Screen profiler for my engine that only calculated major subsystems instead of finer grained work, and even that is useful. Do you handle different threads at all? Even though mine was so simple, as it shows the systems running in parallel it was still useful in helping me achieve my 60fps on 360 🙂 And yeah, implementing the system can be very interesting and in the end extremely rewarding!
Thanks Colin! I don’t have multithreading in Spring Up yet. I will only add it if I really have to. I still have expensive features to add but also some more optimizations left to do. I honestly hope I won’t need multithreading 😉
(NB: I fixed the 404 on the enlarged 3rd screenshot)