Hashi Puzzles: Bridges & Islands is a mobile game that I released a few weeks ago on three mobile platforms: Google Play on November 25th, 2012, App Store (iPhone/iPad) on December 3rd and Amazon App Store on December 18th.
Here are a few statistics about the sales and ads revenue of the game.
The Game
Hashi Puzzles is a logic game (same kind of gameplay than sudoku). This game was an experiment on two specific points:
- I wanted to develop a game very quickly. The initial version was made in 45 hours (read “How I Developed and Released a Game in 45 Hours“)
- I wanted to allow players to spend more than $0.99 if they like the game. Therefore, the game is made up of level packs. Three packs of 20 levels each are available for free. Then, the player can buy up to six packs of 60 levels each for $1.99 per pack. This is considered expensive for a mobile game, even though I think that multiple hours of gameplay for the price of a cookie is still cheap, but that’s not the point here :). I had a few reviews mentioning the price, as expected.
Let’s see some charts.
First stat: Downloads
On the charts the horizontal axis is the number of days since release on the given platorm.
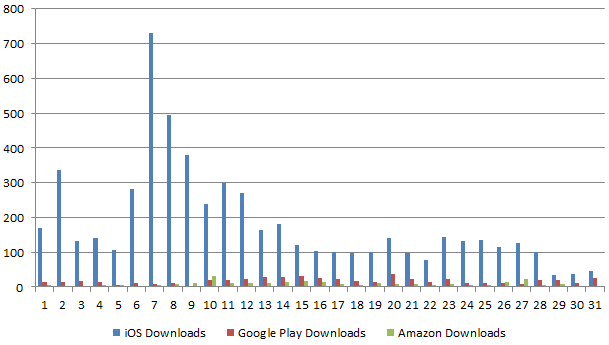
As you can see, on iOS, the downloads are great after the release, probably because of the “New Releases” section. After that, the game was featured in the Puzzle and Family charts in France and USA. The game left the charts on December 31st, and you can see the final drop after day 28.
Downloads are now quite low for every platform (between 5 and 30 per day).
Second stat: Sales
As this is a game with in-apps, a single player can purchase multiple packs of levels. Each pack sold is considered a sale.
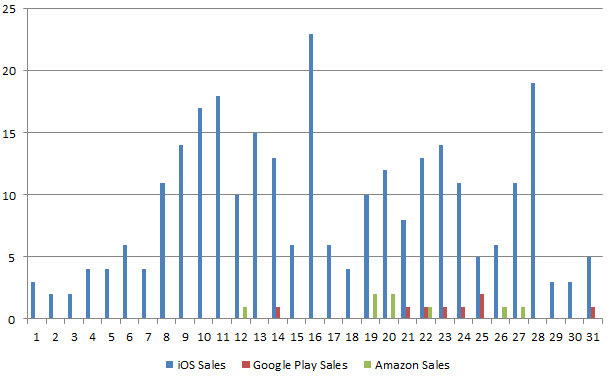 Since the game is released, I’ve had sales everyday on iOS. However, it took 14 and 12 days to get my first sale on Google Play and Amazon respectively!
Obviously, more downloads led to more sales. Let’s see the connection between downloads and sales in the next chart.
Third stat: Sales per Download
This chart shows the number of pack sold for 100 users. For instance, 2% means that on average for 100 downloads, I sell two packs (at $1.99 each). I don’t know if both packs are bought by the same player or different players (this information is only available on Google Play). The horizontal axis goes to 49 days in this one.
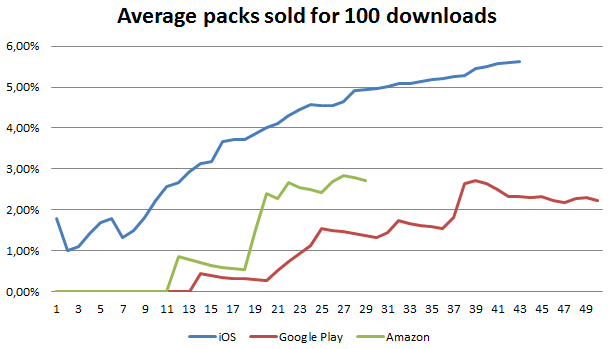 It’s interesting to see that iOS is also much better compared to Android in this chart. Players spend more on iOS (this will not be a surprise to most of you). The value is also still increasing on iOS. I suppose that’s because players downloading the game recently probably searched for the game. They probably like it better that someone that downloaded it right after the release, just because it was new.
Fourth stat: sales per pack
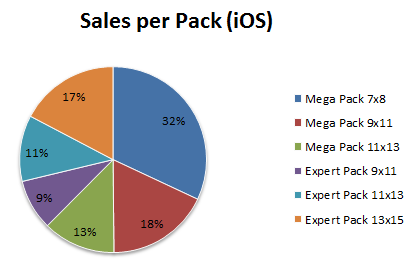 This stats shows that many players bought the last (hardest) pack without purchasing the previous ones. The most sold packs are the first one, second one and last one.
Fifth stat: Revenue repartition
Let’s see now the revenue repartition between sales, ads, iOS, Google Play and Amazon. Please note that ads revenue for Google Play and Amazon are shown together.
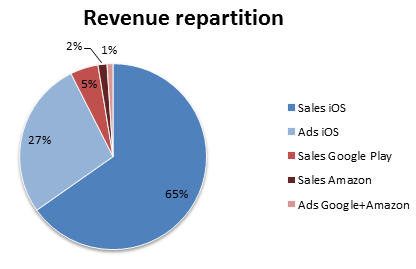
Blue is iOS, Red is Android. No surprise here, given the previous charts.
I use iAd and AdMob on iOS, and AdMob only on Android. I was disappointed by revenue on AdMob Android, especially compared to my previous game Don’t Feed the Trolls (sales stats). However it’s fair to notice that the TTR (Tap Through Ratio, amount of player taping on the ads) is 10 times lower on Hashi Puzzles compared to Don’t Feed the Trolls.
Sixth stat: total revenue per platform
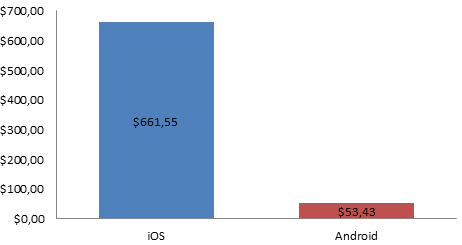
I made more than 12 times more money on iOS compared to Android. This is a surprise to me as once again, I had really different stats with my previous game. Overall, Hashi Puzzles was more successful than Don’t Feed the Trolls. It’s even more successful if we consider that:
- I had no press converage for Hashi: this is a simple game, not very original that most journalist don’t care about
- I spent much less time and money making the game
That’s it! Feel free to share and comment, or ask me anything on twitter @Frozax !
Thanks for the stats, always useful.
iOS users spend more money because they are richer aren’t they? You need some money to have an apple device, so why not spend it on games. But also, as an android user I got used to get free apps unless the annoying ads force me into buying it (or deleting it). Anyway nice to see some figures, so it’s roughly 16$/hour, but I guess you have to pay tax 😉
It would be interesting to have statistics based on the price of the device 😉 Some android devices can be expensive, too.
You’ve had 5000-10000 downloads on Google Play since release. How about a sales per download number for each platform?
Here are the latest numbers of sales per download:
Google Play : 2.33%
iOS : 6.37%
Amazon (low numbers): 4.06%